Guangxi 广西壮族自治区
Région autonome du Guangxi
Retour vers Tableaux par provinces
Retour vers Tableau général des villes de Chine.
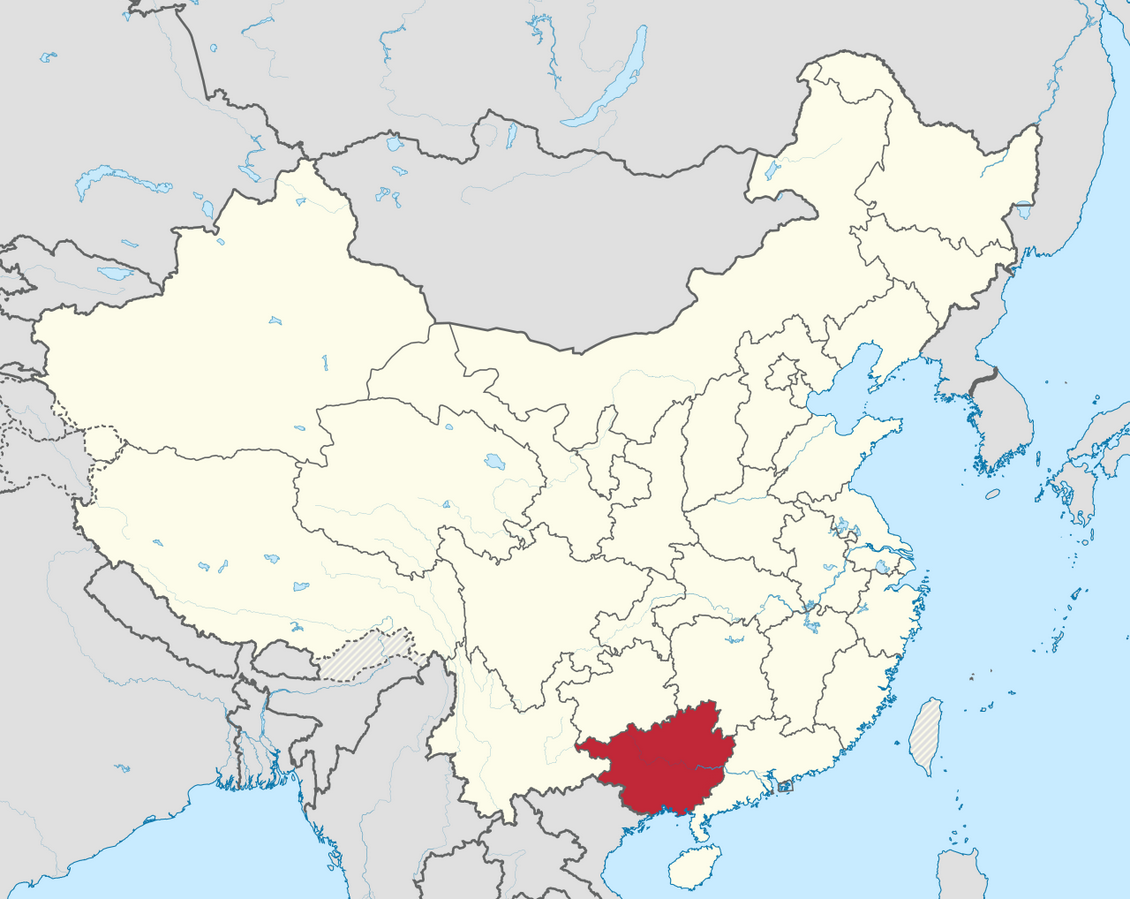
Ci-dessus : Wikimedia Commons.
Ci-dessous : classement des villes par importance démographique décroissante (villes > 300 k : estimation ONU pour 2020. Chiffres en milliers). Cartes : http://map.vbgood.com/China_city_map_collection/. Croquis : J.A. Images : Google Earth Pro.
| Nanning 南宁 |  | 22,8167 | 108,3167 | 3860 | https://fr.wikipedia.org/wiki/Nanning |
| Guigang 贵港 |  | 23,0964 | 109,6092 | 891 | https://fr.wikipedia.org/wiki/Guigang |
| Guiping 桂平 | Guangxi 广西壮族自治区 | 23,3934 | 110,0744 | 891 | https://fr.wikipedia.org/wiki/Guiping |
| Wuzhou 梧州 |  | 23,4832 | 111,2741 | 697 | https://fr.wikipedia.org/wiki/Wuzhou |
| Qinzhou 钦州 |  | 21,9681 | 108,6214 | 644 | https://fr.wikipedia.org/wiki/Qinzhou |
| Yulin 玉林市 |  | 22,6339 | 110,1533 | 614 | https://fr.wikipedia.org/wiki/Yulin_(Guangxi) |
| Cenxi 岑溪 | Guangxi 广西壮族自治区 | 22,9191 | 110,9945 | 566 | https://fr.wikipedia.org/wiki/Cenxi |
| Beihai 北海 |  | 21,4785 | 109,1200 | 487 | https://fr.wikipedia.org/wiki/Beihai_(Guangxi) |
| Fangchenggang 防城港 | guangxi_fangchenggang.gif | 21,7659 | 108,3540 | 420 | https://fr.wikipedia.org/wiki/Fangchenggang |